Image Details
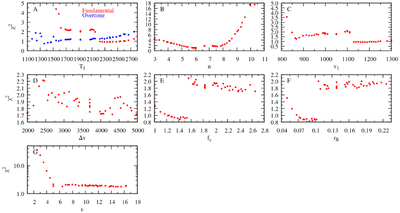
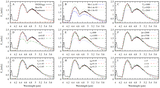
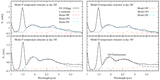
Caption: Figure 6.
Demonstrating the χ2 convergence for each of the seven parameters for Model P at day 385. For each panel, we keep the optimized parameters the same except for the parameter being varied. Panel (A) shows temperature (T1) convergence for both the CO fundamental and overtone bands. For panels (B)-(G) we only show χ2 of the fundamental band because the overtone does not show significant χ2 differences between models (see Figure 5). Panel (B) shows the density structure (n), (C) the inner velocity edge (v1), (D) the width of the molecular region (Δv), (E) the clump density contrast (fc), (F) the clump size (rR), and (G) the clump shape (ϵ). For discussion on the shapes and jumps, see Section 4.1.
Other Images in This Article
Show More
Copyright and Terms & Conditions
© 2026. The Author(s). Published by the American Astronomical Society.