Image Details
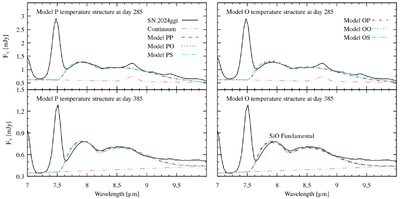
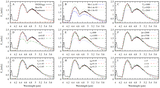
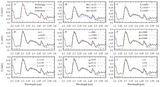
Caption: Figure 10.
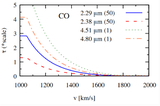
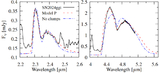
For given initial temperature structures of Models P (left) and O (right, Figure 3) we show our best-fit SiO fundamental bands for prolate (P), oblate (O), and nonclumping (S) models. The continuum used for day 285 shows the identification of a low-bandwidth H line profile at 8.75 μm that overlaps our high-bandwidth molecular feature. Also included in the continuum but not plotted is the edge of the [Ni I] line at 7.5 μm. For parameter values, see Table 2.
Other Images in This Article
Show More
Copyright and Terms & Conditions
© 2026. The Author(s). Published by the American Astronomical Society.
Copyright ©
2026 Astronomy Image Explorer. All Rights Reserved.