Image Details
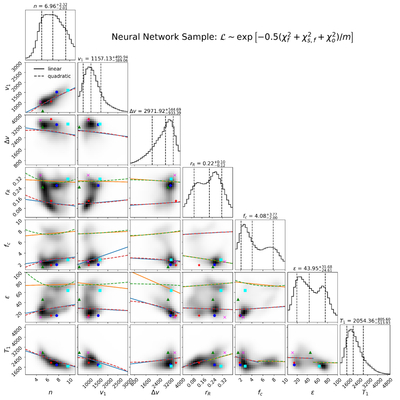
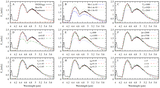
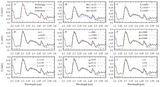
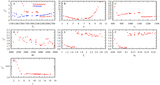
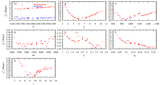
Caption: Figure 16.
Corner plot showing the distribution of parameters for 105 samples drawn from a normalizing flow model trained on 4000 randomly sampled models in the seven-dimensional parameter space. The flow learns an approximation to the underlying likelihood-weighted parameter distribution, which is then sampled to generate a smooth representation of the posterior. Darker regions indicate higher posterior density. The likelihood weights (wi) for the original models were computed from the combined statistic ﹩{\chi }_{\alpha }^{2}={\chi }_{f}^{2}+{\chi }_{f,s}^{2}+{\chi }_{o}^{2}﹩, assuming Gaussian uncertainties, such that ﹩{w}_{i}\propto \exp (-{\chi }_{\alpha ,i}^{2}/2)﹩. For numerical stability, the minimum ﹩{\chi }_{\alpha }^{2}﹩ value was subtracted prior to exponentiation. To mitigate extreme weight concentration, the original likelihoods were tempered by introducing a factor 1/m = 1/110 in the exponential. Linear and quadratic fits are overlaid on each pairwise projection; the corresponding coefficients are listed in Table 4. Parameter sets with ﹩{\chi }_{f}^{2}﹩ (fundamental band) within 5% of the reference model (red star) in Section 4.1 are shown as points with distinct shapes and colors; their corresponding values are listed in Table 3. This plot was generated using the corner.py package (D. Foreman-Mackey 2016).
Other Images in This Article
Show More
Copyright and Terms & Conditions
© 2026. The Author(s). Published by the American Astronomical Society.