Image Details
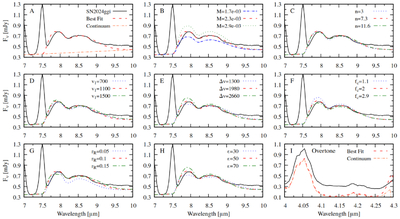
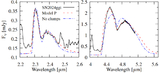
Caption: Figure 13.
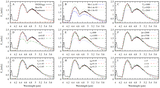
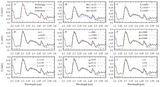
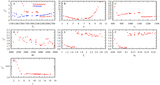
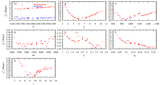
Demonstration of the sensitivity of each parameter to the SiO fundamental band of Model PP at day 385. Panel (A) shows the best-fit solution and continuum. Each of the following panels keeps the optimized parameters the same but shows the effect of: (B) total molecular mass (M), (C) density structure (n), (D) inner velocity edge (v1), (E) width of molecular region (Δv), (F) clump density contrast (fc), (G) clump size (rR), and (H) clump shape (ϵ). Panel (I) shows the lack of the SiO overtone band, where an upper mass limit was established by optimizing this feature. Figures 14 and 15 show the ﹩{\chi }_{* }^{2}﹩ convergences of the fits.
Other Images in This Article
Show More
Copyright and Terms & Conditions
© 2026. The Author(s). Published by the American Astronomical Society.