

Image Details
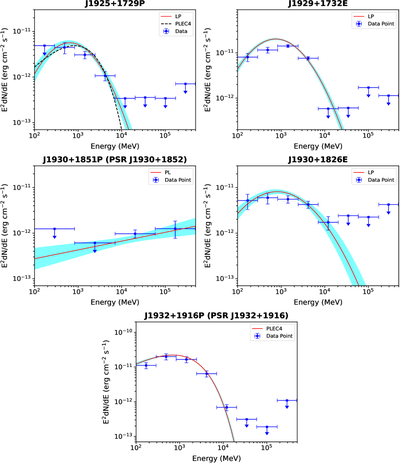
Caption: Figure 2.
SEDs of the emission for the five detected sources in our target region. Red lines and cyan shaded regions represent the best-fit models with 1σ statistical uncertainties, while blue data points indicate the energy flux in each energy bin, with 95% confidence upper limits for bins with TS < 4 shown by arrows. For J1925+1729P, the PLEC4 model (black dashed line) is also shown for comparison.
Other Images in This Article
Copyright and Terms & Conditions
© 2026. The Author(s). Published by the American Astronomical Society.

Copyright ©
2026 Astronomy Image Explorer. All Rights Reserved.
