

Image Details
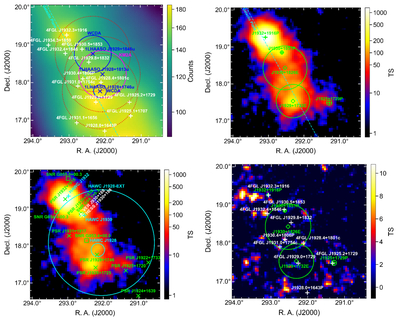
Caption: Figure 1.
Top left: log-scaled ﹩3\mathop{.}\limits^{^\circ }5\times 3\mathop{.}\limits^{^\circ }5﹩ smoothed counts map covering the target region in the 1−500 GeV energy range, with a spatial bin size of ﹩0\mathop{.}\limits^{^\circ }05﹩, and smoothed using a ﹩0\mathop{.}\limits^{^\circ }15﹩ Gaussian kernel. Overlaid are the 4FGL-DR4 sources and two new sources found in the baseline model (white plus symbol), along with the three 1LHAASO source positions (blue cross) and the corresponding 39% containment radii measured by the LHAASO WCDA (blue circle) and KM2A (magenta circle), as well as the 1° regions around them (red dotted circle). The cyan dashed line denotes the Galactic plane. Top right: log-scaled TS excess map of the target region based on the initial model, showing the best-fit 3P+2G model components. Overlaid are the localizations of pointlike sources and the corresponding 95% positional uncertainties (green plus symbol and circle), and the extended source positions and best-fit 68% containment radii (green diamond and circle). Bottom left: similar to the top-right panel, but overlaid with the pulsar radio positions (green cross), SNR positions (green box), TeV associations with PSR J1930+1852 (white cross), and the latest HAWC analysis results (A. Albert et al. 2023) of two pointlike sources HAWC J1930 and HAWC J1932 (cyan plus symbol) and the 39% containment radii of two extended sources, HAWC J1928 and HAWC J1928-EXT (cyan circle). Bottom right: residual TS map after subtracting the best-fit 3P+2G model, overlaid with the model components, the 4FGL-DR4 sources, and two new sources found in the baseline model.
Other Images in This Article
Copyright and Terms & Conditions
© 2026. The Author(s). Published by the American Astronomical Society.

