Image Details
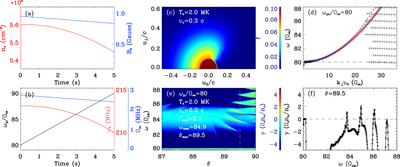
Caption: Figure 8.
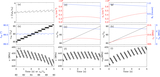
Model setup and Z-mode (UH) wave analysis. (a) Temporal evolution of the plasma density n0 (red) and magnetic field strength B0 (blue) in the radio source region. (b) Profiles of plasma frequency ωpe, electron cyclotron frequency Ωce, and their ratio ωpe/Ωce (red, blue, and black lines, respectively). (c) Electron distribution adopted for the linear growth rate calculation: background Maxwellian (T0 = 2 MK) and energetic electrons with a loss-cone distribution (average velocity ve = 0.3c). (d) Dispersion relations of Z-mode waves in warm plasmas with ωpe/Ωce = 80 for perpendicular propagation, calculated using fluid approximation (red circles) and kinetic theory (black plus signs). The blue line corresponds to the dispersion curve of UH mode, ﹩{\omega }^{2}={\omega }_{p}^{2}+{{\rm{\Omega }}}_{\mathrm{ce}}^{2}+3{k}_{\perp }^{2}{v}_{0}^{2}﹩, and the black dashed line indicates the UH frequency (﹩{\omega }_{\mathrm{UH}}^{2}={\omega }_{\mathrm{pe}}^{2}+{{\rm{\Omega }}}_{\mathrm{ce}}^{2}﹩). (e) Growth rate distribution of Z-mode waves in (ω, θ) space; positive values indicate growth and negative values damping. (f) Growth rate of Z-mode waves at fixed propagation angle θ = 89 ﹩\mathop{.}\limits^{\unicode{x000b0}}﹩5.
Other Images in This Article
Show More
Copyright and Terms & Conditions
© 2026. The Author(s). Published by the American Astronomical Society.