Image Details
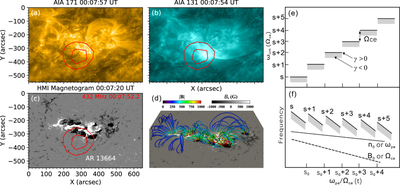
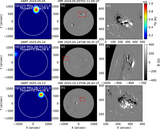
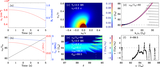
Caption: Figure 7.
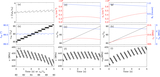
SDO observations and magnetic field modeling of the 2024 May 9 event, along with schematic diagrams illustrating the generation of striped chains. (a), (b) AIA 171 and 131 Å EUV images of AR 13664. (c) HMI line-of-sight magnetogram. Overlaid contours show the simultaneous DART radio sources at 432 MHz (70% and 90% of the maximum brightness temperature). The DART imaging time and frequency are marked in the dynamic spectrum of Figure 3. (d) NLFFF-extrapolated magnetic field lines. (e) Variations of the UH mode frequency as a function of ωpe/Ωce (t). Shaded regions represent absorptions, and γ denotes the growth rate. (f) Schematic of chain formation due to variations of ωpe/Ωce (t).
Other Images in This Article
Show More
Copyright and Terms & Conditions
© 2026. The Author(s). Published by the American Astronomical Society.