

Image Details
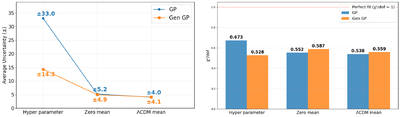
Caption: Figure 3.
The left panel shows the variation of uncertainty in the Hubble constant parameter for both GP and GenGP reconstructions, using both zero-mean and ΛCDM mean functions. For comparison, we also include the case where only the mean function (assumed as ΛCDM) is used, without the full GP or GenGP modeling, prior to applying the covariance matrix (Equation (18)). The right panel presents a comparison of the corresponding χ2 values for each case.
Other Images in This Article
Copyright and Terms & Conditions
© 2026. The Author(s). Published by the American Astronomical Society.

Copyright ©
2026 Astronomy Image Explorer. All Rights Reserved.
