

Image Details
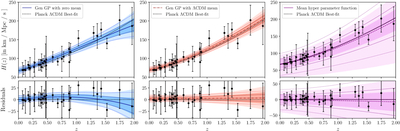
Caption: Figure 2.
Reconstructed evolution of the Hubble parameter H(z) using Gen GP (top panel). The black-dotted curve denotes the Planck best-fit ΛCDM model. The blue- and red-shaded regions indicate the 2σ confidence intervals obtained using a zero-mean prior function and a ΛCDM mean prior function, respectively, using the full marginalized posteriors, while the dashed and dotted lines show the 1σ and 2σ confidence intervals when optimized hyperparameters are employed. The distribution of the mean function for the corresponding hyperparameters is also shown in magenta. The bottom panel shows residuals with respect to the Planck ΛCDM best-fit model. See Sections 5.2 and 5.3 for details.
Other Images in This Article
Copyright and Terms & Conditions
© 2026. The Author(s). Published by the American Astronomical Society.

