Image Details
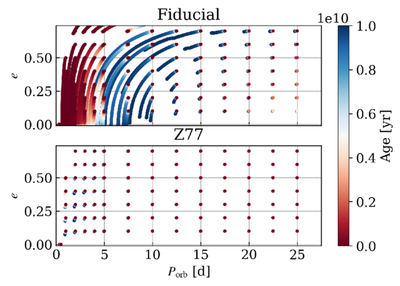
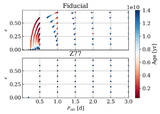
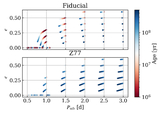
Caption: Figure 4.
Time evolution of e and Porb for 1 M⊙ + 1 M⊙ binaries over a grid of initial orbital periods and initial eccentricities, with our fiducial tides model (top panel) and the Z77 tides model (bottom panel). Each binary is initiated at a grid point, and the colors depict the age of each simulation snapshot in years. The binaries are only evolved up to their MS lifetimes (approximately 10 Gyr) in this section.
Other Images in This Article
Copyright and Terms & Conditions
© 2026. The Author(s). Published by the American Astronomical Society.
Copyright ©
2026 Astronomy Image Explorer. All Rights Reserved.