Image Details
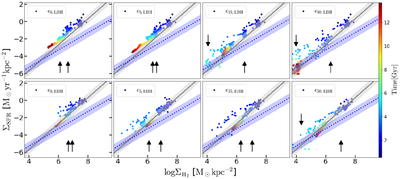
Caption: Figure 5.
ΣSFR vs. ﹩{{\rm{\Sigma }}}_{{{\rm{H}}}_{2}}﹩ for all gas inside 0.1Rvir. ﹩{{\rm{\Sigma }}}_{{\rm{SFR}}}=A{({{\rm{\Sigma }}}_{{{\rm{H}}}_{2}})}^{n}﹩ with depletion times of τdep = 2 Gyr and slope n = 1 (e.g., F. Bigiel et al. 2008; A. K. Leroy et al. 2013) is given by dotted line, while τdep = 0.5 Gyr and n = 1.5 (e.g., R. Genzel et al. 2015; N. Scoville et al. 2017; L. J. Tacconi et al. 2018) is given by the solid line. The color of the markers indicates time. The shaded regions represent ±0.5 dex around the relations. There is a single data point for each 30 Myr of evolution during z = 9–0. The black arrows indicate z = 2 and z = 1.
Other Images in This Article


Show More
Copyright and Terms & Conditions
© 2026. The Author(s). Published by the American Astronomical Society.