Image Details
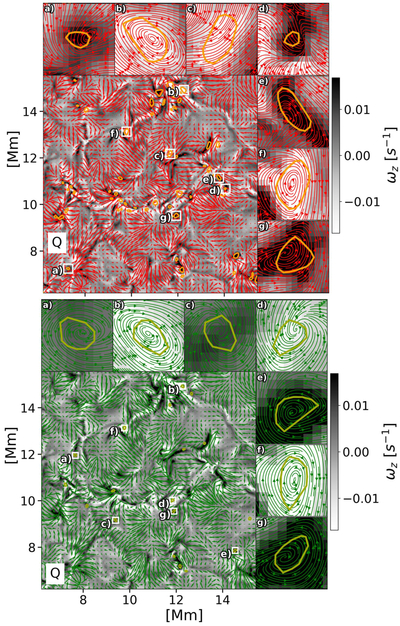
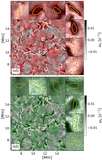
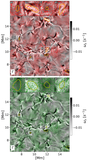
Caption: Figure 7.
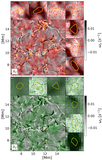
A subdomain at t = 0 (index number 249), where we show the detection results for the Q criterion on a quiver plot of the velocity field. The background shows the z-component of vorticity. The top panel (red) shows the AVF detections, and the bottom panel (green) displays the UVF detection results. In the tiles surrounding each panel, we show a zoomed-in picture of the convex hulls for a selection of the detections with streamlines tracing the unnormalized horizontal velocity field.
Other Images in This Article
Show More
Copyright and Terms & Conditions
© 2026. The Author(s). Published by the American Astronomical Society.
Copyright ©
2026 Astronomy Image Explorer. All Rights Reserved.