Image Details
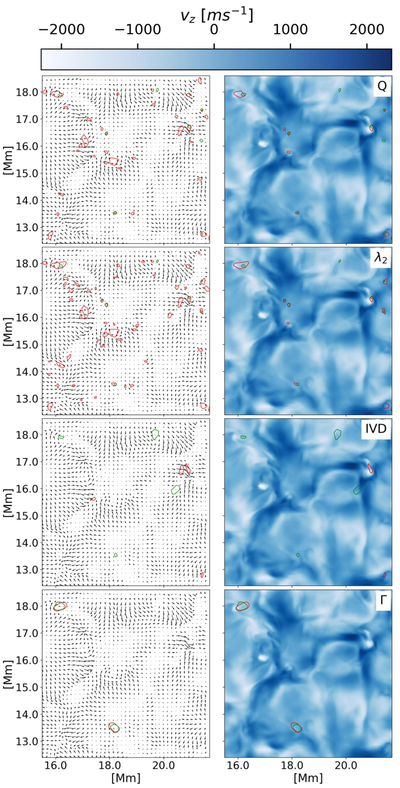
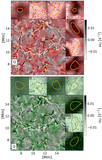
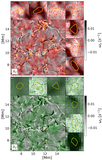
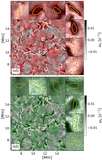
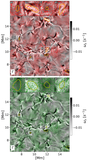
Caption: Figure 6.
Here, we display a subset of the domain, in which we visualize how successful each vortex detection method is when using the d-criterion centers as a ground truth. The left column shows all vortex detection results from each detection method; the UVF results are shown in green, and the AVF results are plotted in red. The remaining detections in the right-hand-side column show only those that have been validated by a d-criterion center. These validated vortices are plotted against the z-component of velocity.
Other Images in This Article
Show More
Copyright and Terms & Conditions
© 2026. The Author(s). Published by the American Astronomical Society.
Copyright ©
2026 Astronomy Image Explorer. All Rights Reserved.