Image Details
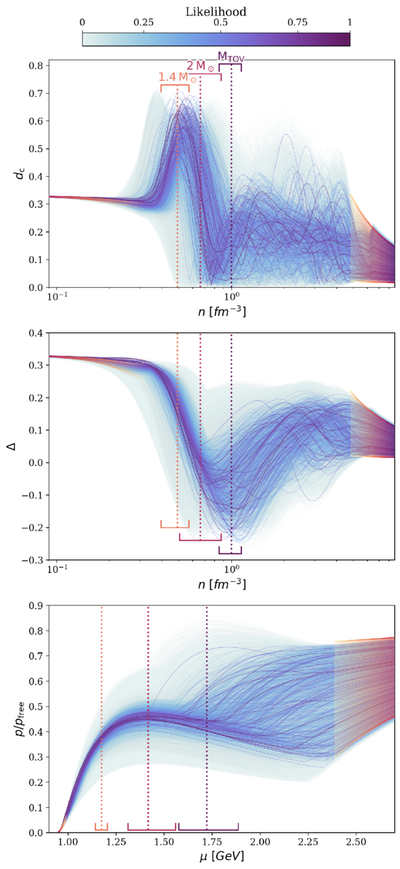
Caption: Figure 7.
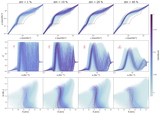
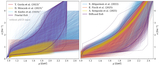
Posterior of dc(n), Δ(n), and p/pfree(μ) (see main text for definitions) from the hierarchical model discussed in Section 4 with the correlation length taken from a uniform distribution σ/n ∈ [0.2, 0.4]. The dotted vertical lines and the associated bars correspond to the mean and 1σ credible interval for densities reached in the centers of 1.4 M⊙, 2 M⊙, and MTOV stars.
Other Images in This Article
Copyright and Terms & Conditions
© 2026. The Author(s). Published by the American Astronomical Society.
Copyright ©
2026 Astronomy Image Explorer. All Rights Reserved.