Image Details
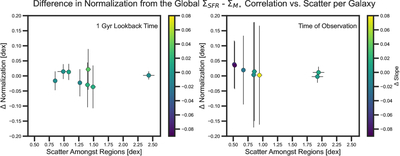
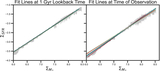
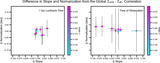
Caption: Figure 9.
The two panels show how the slope, normalization, and scatter of each galaxy’s regional log ﹩{{\rm{\Sigma }}}_{{M}_{\ast }}﹩–log ΣSFR correlation differ from the global relation, which is centered on log ﹩{{\rm{\Sigma }}}_{{M}_{\ast }}﹩= 7.25 [M⊙ kpc−2]. The left panel shows the 1 Gyr lookback time, and the right panel shows the time of observation. At 1 Gyr, slopes are nearly identical across galaxies, but normalizations differ somewhat. At the time of observation, slopes vary while normalizations are similar. The scatter in each galaxy’s fit does not correlate with either slope or normalization.
Other Images in This Article
Show More
Copyright and Terms & Conditions
© 2026. The Author(s). Published by the American Astronomical Society.