Image Details
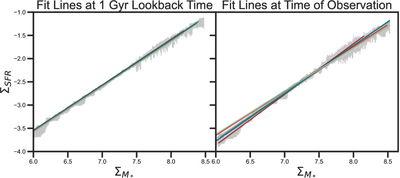
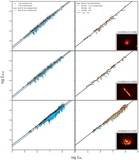
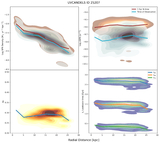
Caption: Figure 7.
log ΣSFR–log ﹩{{\rm{\Sigma }}}_{{M}_{\ast }}﹩correlation fit lines for all galaxies are shown on the left at 1 Gyr lookback time and on the right at the time of observation. The gray shading shows the rolling 1σ confidence interval for all regions of all galaxies. At 1 Gyr lookback time, all galaxies lie on the same SFR–M∗ correlation, but the differing slopes and normalizations at the time of observation suggest that galaxies have since begun quenching in different ways.
Other Images in This Article
Show More
Copyright and Terms & Conditions
© 2026. The Author(s). Published by the American Astronomical Society.
Copyright ©
2026 Astronomy Image Explorer. All Rights Reserved.