Image Details
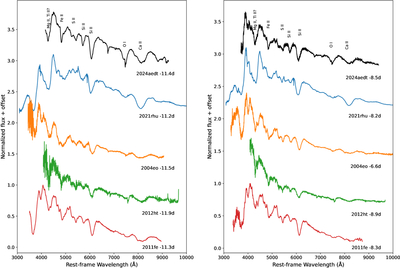
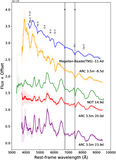
Caption: Figure 10.
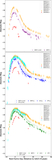
Comparison of spectra at similar phases. The spectrum of SN 2024aedt is shown in black, plotted against other SNe Ia from the comparison sample. Each spectrum is normalized and vertically offset for clarity. See Section 3.4.2 for details.
Other Images in This Article
Show More
Copyright and Terms & Conditions
© 2026. The Author(s). Published by the American Astronomical Society.
Copyright ©
2026 Astronomy Image Explorer. All Rights Reserved.