Image Details
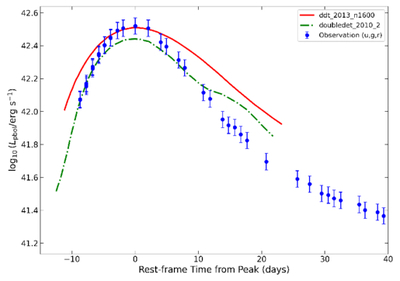
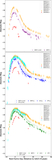
Caption: Figure 18.
Comparison of the pseudobolometric light curve of SN 2024aedt (blue circles) with selected explosion models. The red solid line represents the best-fit DDT model, and the green dotted–dashed line represents the DDet model. The pseudobolometric luminosity is integrated over the wavelength range covered by the u, g, and r bands. For the observations, the light curve was derived by integrating the SED approximated from the u, g, and r photometry.
Other Images in This Article
Show More
Copyright and Terms & Conditions
© 2026. The Author(s). Published by the American Astronomical Society.
Copyright ©
2026 Astronomy Image Explorer. All Rights Reserved.