Image Details
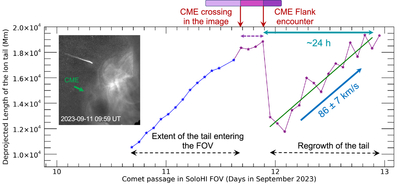
Caption: Figure 4.
Rate of regrowth of the ion tail after the disconnection event. The inset figure shows the comet and the CME as they propagate in the SoloHI tile 2 FOV. The abrupt decrease in tail length near 19:00 UT on 2023 September 11 indicates the tail disconnection, following the CME crossing and flank encounter (red arrows on the top). The extent of the comet’s tail entering the FOV is shown in blue symbols in the plot. The tail remains fully within the FOV for four consecutive frames (marked by the purple arrow), after which the disconnection and regrowth are observed. The purple overbar marks the CME’s passage duration through the SoloHI FOV, CME’s entry (light purple), the leading-edge passage in projection before the comet–CME interaction (medium), and the interval after the comet crosses the CME flank (dark). The growth rate is determined from the slope of the linear fit indicated by the green line.
Other Images in This Article
Copyright and Terms & Conditions
© 2026. The Author(s). Published by the American Astronomical Society.