Image Details
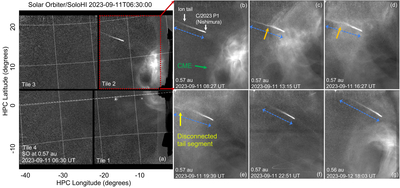
Caption: Figure 2.
SoloHI observations of the C/2023 P1 comet–CME interaction on 2023 September 11. (a) Snapshot of the full SoloHI mosaic FOV, where the Sun is to the right of the image. The grid, delineated by continuous lines, depicts the longitude and latitude in the HPC coordinate system, and the dashed line indicates the ecliptic plane. (b)–(g) Time sequence of the selected image frames of the subfield marked in a red box of panel (a) showcasing the comet–CME interaction. The orange arrows highlight the kink in the tail, and the yellow arrow indicates the detached tail. After disconnection, tail regrowth is shown in the last two snapshots of the sequence, as indicated by the tail length and intensity, highlighted by the blue dashed arrows. A movie illustrating the overall evolution of the comet and its interactions with CMEs and TDEs is available in the online version of the article. The movie first presents the wide-field evolution in a mosaic view of tiles 3 and 2, followed by a zoomed-in view of the selected subfield.
(An animation of this figure is available in the online article.)
(An animation of this figure is available.)
The video/animation of this figure is available in the online journal.
Other Images in This Article
Copyright and Terms & Conditions
© 2026. The Author(s). Published by the American Astronomical Society.