Image Details
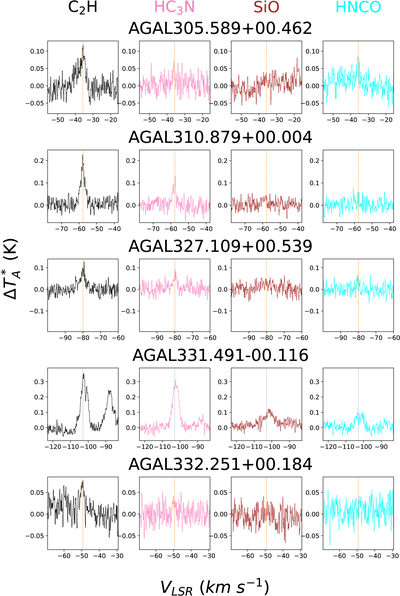
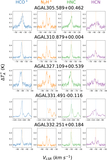
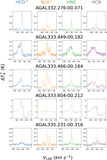
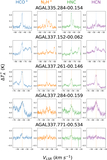
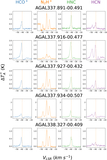
Caption: Figure 10.
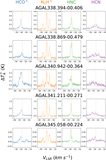
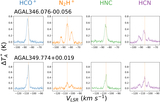
Mopra 3 mm spectra of the C2H (N = 1–0; J = 3/2–1/2; F = 2–1), HC3N (10–9), HNCO (40,4–30,3), and SiO (2–1) lines. The vertical lines show the fitted velocity of the N2H+ (1–0) line in orange, if available, otherwise the velocity of the peak HCO+ (1–0) intensity in cyan.
Other Images in This Article
Show More
Copyright and Terms & Conditions
© 2026. The Author(s). Published by the American Astronomical Society.
Copyright ©
2026 Astronomy Image Explorer. All Rights Reserved.