

Image Details
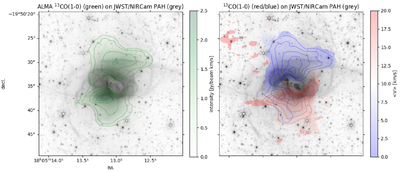
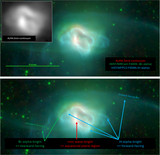
Caption: Figure 6.
Left: overlay of a velocity-integrated ALMA 13CO(1–0) emission-line map (green linear intensity scale, with green contours) on JWST/NIRCam 3.56 μm PAH imaging (logarithmic gray scale). The contours are set to levels of 0.25, 0.5, 1.0, 1.5, 2.0, and 2.5 Jy beam−1 km s−1. Right: intensity-weighted velocity map of ALMA 13CO(1–0) emission, showing blueshifted and redshifted emission (see color bar) on JWST/NIRCam 3.56 μm PAH imaging (gray scale), with contours of velocity-integrated blueshifted (0–9 km s−1) and redshifted (11–20 km s−1) 13CO(1–0) emission overlaid; the contours are set to levels of 0.25, 0.5, 0.75, 1.0, 1.25, and 1.5 Jy beam−1 km s−1.
Other Images in This Article
Copyright and Terms & Conditions
© 2025. The Author(s). Published by the American Astronomical Society.

