

Image Details
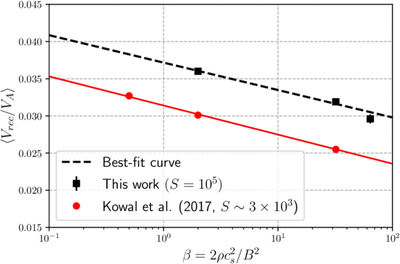
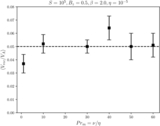
Caption: Figure 8.
Time averaged reconnection rate for different values of plasma−β. The black dashed line is the best-fit curve, ﹩\langle {V}_{\,\rm{rec}\,}/{V}_{{\rm{A}}}\rangle =0.0372-0.0016\mathrm{log}\beta ﹩. The red dots and line represent the results from self-generated turbulent reconnection performed by G. Kowal et al. (2017).
Other Images in This Article
Show More
Copyright and Terms & Conditions
© 2025. The Author(s). Published by the American Astronomical Society.

Copyright ©
2026 Astronomy Image Explorer. All Rights Reserved.
