

Image Details
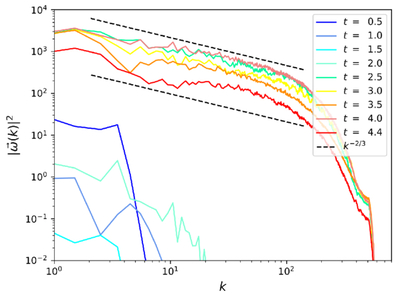
Caption: Figure 11.
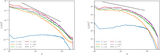
Power spectra of the vorticity field in the x−z plane (current sheet midplane) at different time steps of the simulation with S = 105, β = 2.0, and Prm = 50. The black dashed lines represents the 2D Kolmogorov turbulent power spectrum of ﹩{ \mathcal P }(k)\propto {k}^{-2/3}﹩.
Other Images in This Article
Show More
Copyright and Terms & Conditions
© 2025. The Author(s). Published by the American Astronomical Society.

Copyright ©
2026 Astronomy Image Explorer. All Rights Reserved.
