

Image Details
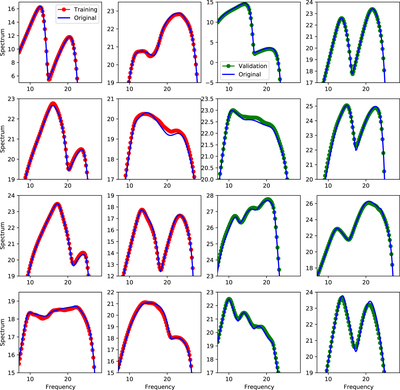
Caption: Figure 3.
Comparison between the ν F ν spectra computed by the CNN (dots) and by SOPRANO (solid line) before unit conversion and expression in the observer frame. The x-axis is the comoving frequency in units of hertz. Left panel: spectra from the training set. Right panel: analogous spectra from the validation set. This figure shows the large diversity of spectra the CNN must be (and is) able to reproduce, the accuracy at which it reproduces them, and the wide span of the typical emitted power across the leptonic SSC model.
Other Images in This Article
Copyright and Terms & Conditions
© 2024. The Author(s). Published by the American Astronomical Society.

Copyright ©
2026 Astronomy Image Explorer. All Rights Reserved.
