

Image Details
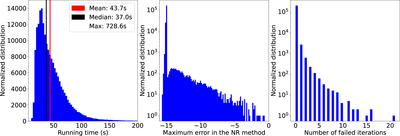
Caption: Figure 1.
Left panel: distribution of the computation time for all simulations in the table model. The average compute time is 43.7 s while the median time is 37 s. Middle panel: distribution of the maximum error in the Newton–Raphson method over the course of one simulation. We note that the ordinate is in logarithmic scale. Most of the spectra achieve the targeted relative error of 10−15. On the other hand, the computation of a small fraction of spectra (1.8%) is seen to fail with a larger error. Right panel: number of failed time iterations by the simulations, which is zero for most of our simulations, while fewer than 1.8% of our simulations have a number of failures larger than zero.
Other Images in This Article
Copyright and Terms & Conditions
© 2024. The Author(s). Published by the American Astronomical Society.

