Image Details
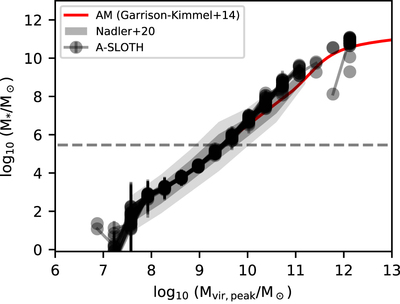
Caption: Figure 10.
We show the SMHMs at z = 0 of 30 Caterpillar trees from our best model. At given M vir,peak, we show the mean M * (gray circles) and the standard deviation among the galaxies from each tree. We also plot the SMHM derived by Nadler et al. (2020) as a gray contour, where the dark gray shows the 1σ region and the light gray shows the 2σ region. The SMHM derived with the AM technique by Garrison-Kimmel et al. (2014) is plotted with a red curve until the observational completeness.
Other Images in This Article

Show More
Copyright and Terms & Conditions
© 2022. The Author(s). Published by the American Astronomical Society.
Copyright ©
2025 Astronomy Image Explorer. All Rights Reserved.