Image Details
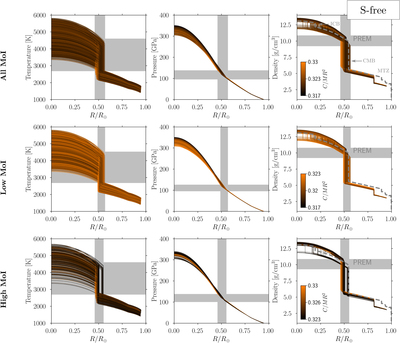
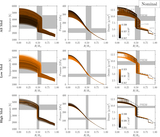
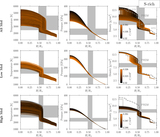
Caption: Figure 4.
Internal temperature (left), pressure (center), and density (right) profiles of the S-free Venus models (﹩{X}_{\mathrm{FeS}}^{\mathrm{Core}}=0﹩) as a function of the radial distance from the center R in units of earth radii, R⊕. The top row shows all possible profiles for the allowed range of the MoI. The middle and bottom rows show only the profiles within ±1% of the lowest and highest possible value of MoI. The MoI value is indicated by different colors. The gray shaded regions indicate the possible ranges for the size of the core along the x-axes and the corresponding temperature, pressure, and density ranges along the y-axes at the CMB. The dashed lines denote the density profile for the Earth from the preliminary Earth reference model.
Other Images in This Article
Show More
Copyright and Terms & Conditions
© 2022. The Author(s). Published by the American Astronomical Society.