Image Details
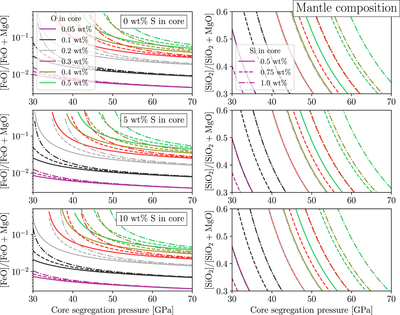
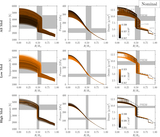
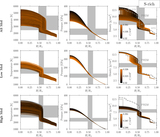
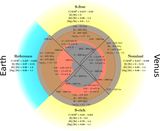
Caption: Figure 3.
FeO and SiO2 content in the mantle as function of the core-segregation pressure, PCS, computed from the metal-silicate partitioning model given by Equations (6) and (7) for different core compositions. The colors denote different O contents; the line styles different Si contents; and the three rows correspond to 0, 5, and 10 wt% of S in the core, respectively.
Other Images in This Article
Show More
Copyright and Terms & Conditions
© 2022. The Author(s). Published by the American Astronomical Society.
Copyright ©
2025 Astronomy Image Explorer. All Rights Reserved.