Image Details
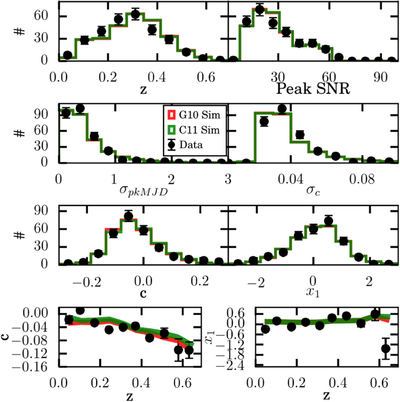
Caption: Figure 7.
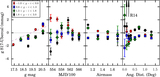
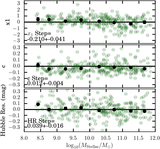
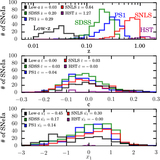
Comparison of distributions for PS1 data (points) and simulations (histograms), where each simulation distribution is scaled to have the same sample size as the data. We show the simulation of the survey assuming a G10 scatter model for the intrinsic dispersion (red) and assuming a C11 scatter model (green). The distributions are shown over redshift, error in the peak MJD, error in the color c, peak S/N of the light curve, fitted SALT2 color (c), and light-curve shape parameter (x1). The bottom two panels show the SALT2 color (c) and shape parameter (x1) vs. redshift.
Other Images in This Article
Show More
Copyright and Terms & Conditions
© 2018. The American Astronomical Society. All rights reserved.
Copyright ©
2026 Astronomy Image Explorer. All Rights Reserved.