Image Details
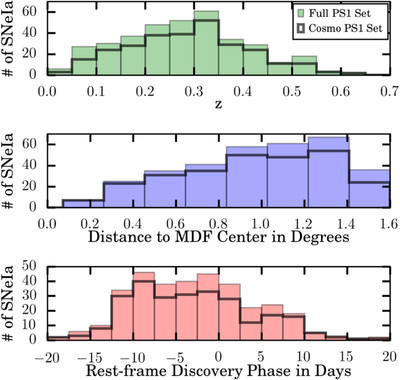
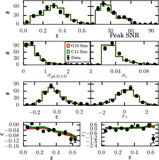
Caption: Figure 2.
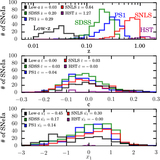
Histograms comparing the set of all spectroscopically confirmed SNe Ia against the subset that is deemed cosmologically useful. Filled bars indicate the full spectroscopic sample of ﹩365﹩ SNe Ia, while outlined bars indicate the ﹩279﹩ used for our cosmology analysis. Top: distribution of redshift. Middle: distribution of radial angular distance from center of focal plane. Bottom: distribution of the age at discovery as determined from the date of peak brightness subtracted from the discovery date.
Other Images in This Article
Show More
Copyright and Terms & Conditions
© 2018. The American Astronomical Society. All rights reserved.
Copyright ©
2026 Astronomy Image Explorer. All Rights Reserved.