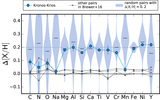
Image Details
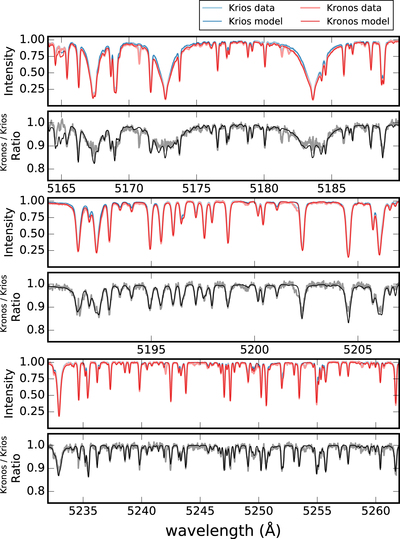
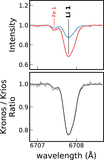
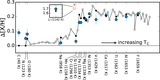
Caption: Figure 3.
Selective segments of the spectra of Krios and Kronos. Alternating sets of two rows show the continuum-normalized data and model in the upper panel, and the ratio (Kronos/Krios) of data (gray) and model (black) in the lower panel.
Other Images in This Article
Copyright and Terms & Conditions
© 2018. The American Astronomical Society. All rights reserved.
Copyright ©
2026 Astronomy Image Explorer. All Rights Reserved.