Image Details
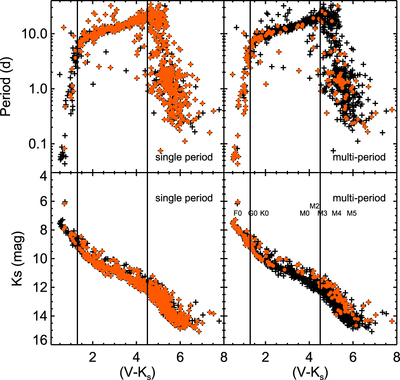
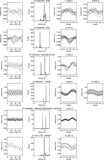
Caption: Figure 13.
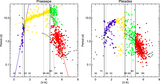
Plot of P vs. ﹩(V-{K}_{{\rm{s}}})﹩ (top row) and ﹩{K}_{{\rm{s}}}﹩ vs. ﹩(V-{K}_{{\rm{s}}})﹩ (bottom row) highlighting the single-period (left) and multi-period (right) populations. The vertical lines are at ﹩(V-{K}_{{\rm{s}}})﹩ = 1.3 and 4.5, the divisions are from Figure 7 above, for reference. The multi-period stars dominate for ﹩(V-{K}_{{\rm{s}}})﹩ ≲ 1.5–2. The M stars that are multi-periodic are more likely to be photometric binaries, as in the Pleiades.
Other Images in This Article
Show More
Copyright and Terms & Conditions
© 2017. The American Astronomical Society. All rights reserved.
Copyright ©
2026 Astronomy Image Explorer. All Rights Reserved.