Image Details
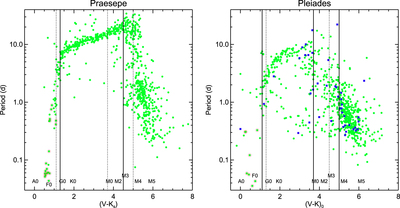
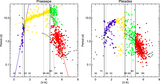
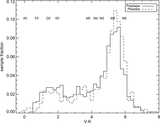
Caption: Figure 6.
Plot of P vs. ﹩(V-{K}_{{\rm{s}}})﹩ for Praesepe (left) and the Pleiades (right). The Pleiades plot is from Rebull et al. (2016b), their Figure 9. In the Pleiades, we had the best members (green dots) and the lower confidence members (blue squares). Likely pulsators (see Rebull et al. 2016a for the Pleiades) have an additional red circle in both panels. There is clearly considerable change between the age of the Pleiades and that of Praesepe. In each plot, the solid vertical lines denote different regions of the diagram defined in the discussion; the dotted vertical lines are the lines from the other cluster (the solid lines in the Praesepe plot are the dotted lines in the Pleiades plot and vice versa).
Other Images in This Article
Show More
Copyright and Terms & Conditions
© 2017. The American Astronomical Society. All rights reserved.