Image Details
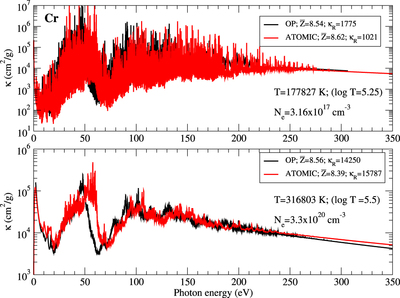
Caption: Figure 3.
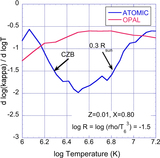
Comparison of the opacity of Cr from the OP database (Badnell et al. 2005; black lines) and the current ATOMIC calculations (red lines) at two different sets of temperatures (T) and electron densities (Ne) as indicated. The average ionization (﹩\bar{Z}﹩), and Rosseland mean opacity (﹩{\kappa }_{R}﹩), in cm2/g, are indicated in the figure captions.
Other Images in This Article
Copyright and Terms & Conditions
© 2016. The American Astronomical Society. All rights reserved.
Copyright ©
2025 Astronomy Image Explorer. All Rights Reserved.