Image Details
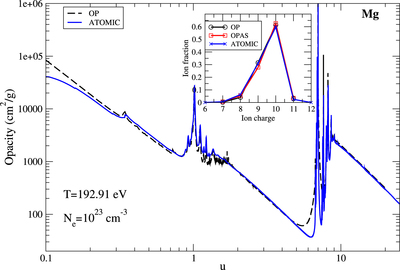
Caption: Figure 1.
Comparison of Mg opacity (as a function of ﹩u=h\nu /{kT}﹩) at a temperature of 192.91 eV and an electron density of 1023 cm−3. The current ATOMIC calculation (blue curve) is compared with an OP calculation (black dashed line; Badnell et al. 2005). The inset shows the ionization balance of Mg at the same conditions where we compare the current ATOMIC calculations (blue crosses) with OP (black circles; Badnell et al. 2005) and OPAS (red squares) calculations (Blancard et al. 2012).
Other Images in This Article
Copyright and Terms & Conditions
© 2016. The American Astronomical Society. All rights reserved.
Copyright ©
2025 Astronomy Image Explorer. All Rights Reserved.