Image Details
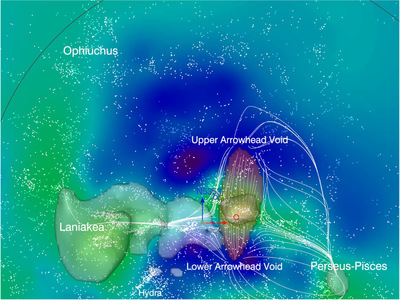
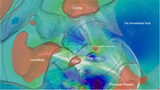
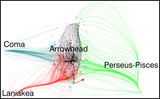
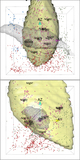
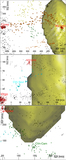
Caption: Figure 3.
Arrowhead Supercluster squeezed between Laniakea and Perseus–Pisces superclusters. The view is of an SGX−SGZ slice in the interval ﹩1500\lt \mathrm{SGY}\lt 3500﹩ km s−1. Shades of green and blue indicate levels of density, from higher to lower respectively. Translucent contours show an isodensity surface. Flow lines are shown for seeds near the inside and outside of the Arrowhead Supercluster, indicated by the dark surface. White dots are galaxies within the slice drawn from the XSCz catalog.
Other Images in This Article
Copyright and Terms & Conditions
© 2015. The American Astronomical Society. All rights reserved.
Copyright ©
2026 Astronomy Image Explorer. All Rights Reserved.