Image Details
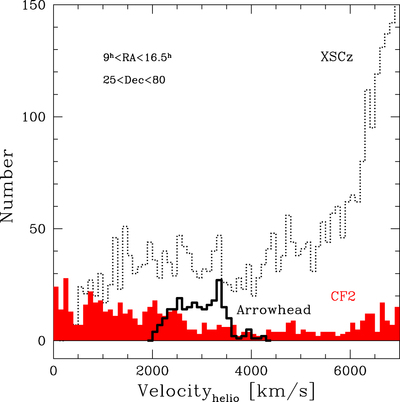
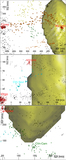
Caption: Figure 2.
Filled red histogram: number of galaxies in 100 km s−1 bins with CF2 distance measurements in a region enclosing the Arrowhead Supercluster. Dotted histogram: number of galaxies in the same region from XSCz. Heavy open histogram: XSCz galaxies within Arrowhead Supercluster.
Other Images in This Article
Copyright and Terms & Conditions
© 2015. The American Astronomical Society. All rights reserved.
Copyright ©
2026 Astronomy Image Explorer. All Rights Reserved.