Image Details
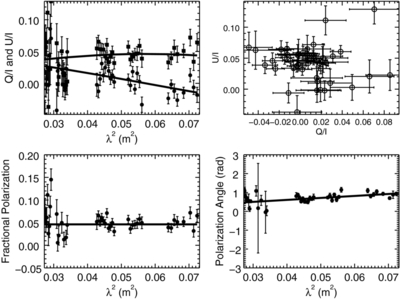
Caption: Figure 4.
Polarized emission of source J1330+4703b and the corresponding best fit (solid line) to the uniform external Faraday screen model. We show the fractional Q (filled squares) and U (filled circles) vs. λ2 in the top left plot. The top right plot shows the Q/I-U/I track. The bottom left plot shows the fractional polarization vs. λ2 trend. The bottom right plot shows how polarization angles vary across L band.
Other Images in This Article


Show More
Copyright and Terms & Conditions
© 2015. The American Astronomical Society. All rights reserved.
Copyright ©
2026 Astronomy Image Explorer. All Rights Reserved.