Image Details
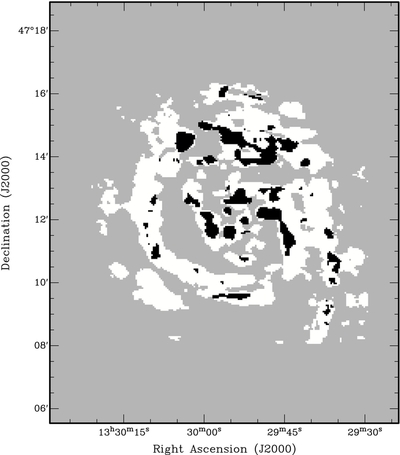
Caption: Figure 10.
Map of M51 showing the spatial distribution of the best-fit model from directly fitting to Stokes Q and U. Sight lines with Q U vs. λ2 behaviors best fitted by a uniform external Faraday screen are denoted by the white pixels. Sight lines with Q U vs. λ2 behaviors best fitted by an inhomogeneous external Faraday screen are denoted by the black pixels. Pixels with insufficient signal-to-noise detection in polarization have been blanked (gray).
Other Images in This Article


Show More
Copyright and Terms & Conditions
© 2015. The American Astronomical Society. All rights reserved.
Copyright ©
2026 Astronomy Image Explorer. All Rights Reserved.