Image Details
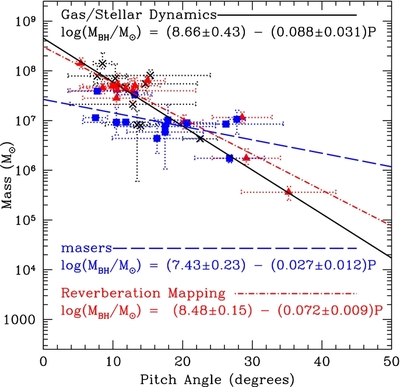
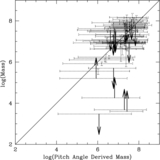
Caption: Figure 2.
Black hole mass vs. pitch angle for all spiral galaxies with directly measured black hole masses available. Black hole masses measured using stellar and gas dynamics techniques (10 points) are labeled with black ×'s, reverberation mapping masses with red triangles (14 points), and maser measurements with blue squares (13 points). The figure shows three separate fits for the three subsamples. The black solid line is a fit to the gas/stellar dynamics data (black ×'s), the dashed blue line is a fit to the maser modeling data (blue squares), and the dot-dashed red line is a fit to the reverberation mapping data (red triangles). The gas/stellar dynamics fit and the reverberation mapping fit are fairly compatible and both close to the overall fit. The maser modeling data, however, follows a noticeably shallower slope. Given their small sizes it is difficult to be certain if there is really a conflict between the subsamples.
Other Images in This Article
Copyright and Terms & Conditions
© 2013. The American Astronomical Society. All rights reserved.