Image Details
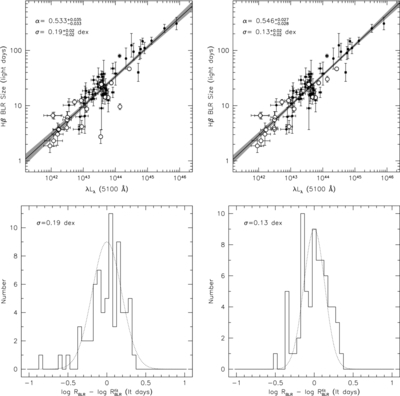
Caption: Figure 11.
Top: Hβ BLR radius vs. the 5100 Å AGN luminosity. The solid line is the best fit to the data and the gray-scale region shows the range allowed by the uncertainties on the best fit. The left panel displays all 71 data points included in this analysis, where the open circles are the new measurements that we include for the first time. The right panel shows the fit with Mrk 142 removed, an adopted lag for PG 2130+099 of 31 ± 4 days, and a reddening correction of 0.26 dex for NGC 3227 (see the text for details). The slope does not change appreciably with these adjustments, but the scatter is significantly reduced from 0.19 dex to 0.13 dex. All measurements are plotted with their associated uncertainties, but the error bars are sometimes smaller than the plot symbols. Bottom: residuals of the estimated BLR radii compared to the measured BLR radii using the best fit to the R BLR– L relationship. The dotted lines are Gaussian functions with a width equal to the variance in the scatter determined from the best fit, demonstrating the relative normality of the residual distribution.
Other Images in This Article
Copyright and Terms & Conditions
© 2013. The American Astronomical Society. All rights reserved.