Image Details
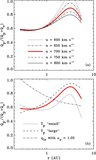
Caption: Figure 2.
Empirically derived heating rates for protons (solid lines) and electrons (dashed lines) in the fast solar wind, with multiple curves showing results for u = 600, 650, 700, 750, and 800 km s −1 (from bottom to top for each set of curves). Shown for comparison is Q turb (Equation (15)) for five values of λ ⊥ at 1 AU (dotted lines). All heating rates have been multiplied by ( r/1 AU) 4. Example error bars are given for the u = 700 km s −1 case (see the text).
Other Images in This Article
Copyright and Terms & Conditions
© 2009. The American Astronomical Society. All rights reserved.
Copyright ©
2025 Astronomy Image Explorer. All Rights Reserved.