Image Details
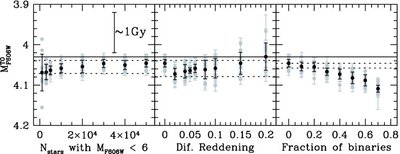
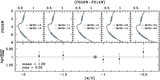
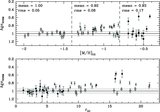
Caption: Figure 4.
Right panel shows M TO F606 W measurements over synthetic CMDs with 50,000 stars brighter than M F606 W = 6, no differential reddening, and varying the fraction of binary stars. Grey points show the MSTO measurements for the 10 different CMDs generated in each case, and black points show the average and standard deviation of each of the 10 measurement sets. Solid line represents the MSTO's magnitude measured directly on the isochrone. The central panel shows the same as left panel, but now the fraction of binary stars is 0.0 and the maximum differential reddening is varying between 0.0 and 0.2. The left panel shows the same, but now the fraction of binary stars is 0.0, the differential reddening is 0.0 and the number of stars brighter then M F606 W = 6 is varying between 1000 and 50,000. Dashed lines represent the adopted ±σ in each case. See text for details.
Other Images in This Article

Show More
Copyright and Terms & Conditions
© 2009. The American Astronomical Society. All rights reserved.