

Image Details
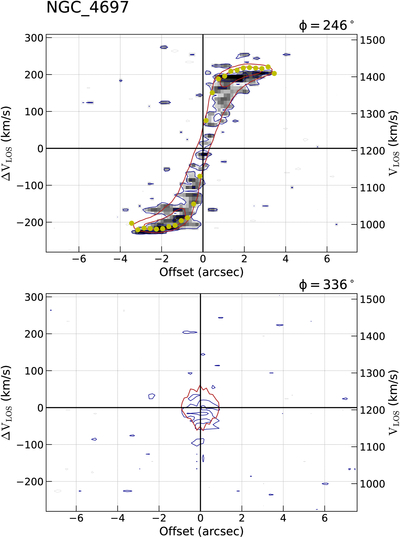
Caption: Figure 9.
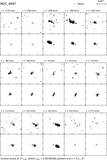
NGC 4697 CO(1–0) PV maps along major and minor kinematic axes. The yellow dots show the fitted rotation curve (using 3DBAROLO) and the red contours represent the corresponding PV map model produced by the same method. Areas within the red contours that seem devoid of signal are just below the plotting threshold applied automatically by 3DBAROLO when producing the plots.
Other Images in This Article
Show More
Copyright and Terms & Conditions
© 2026. The Author(s). Published by the American Astronomical Society.

Copyright ©
2026 Astronomy Image Explorer. All Rights Reserved.
