

Image Details
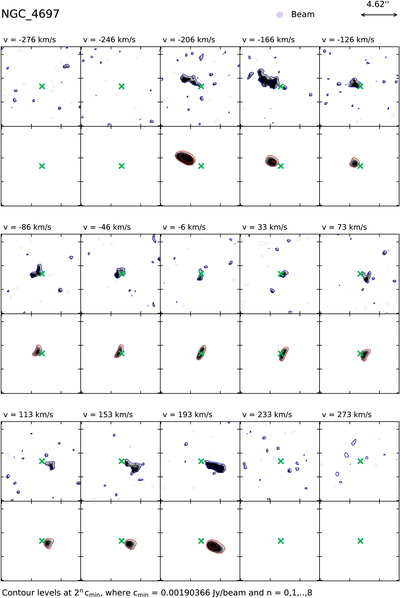
Caption: Figure 10.
(a) NGC 4697 CO(1–0) channel maps centered at the systematic velocity of this galaxy. For each of the three subplots, the upper row shows the actual data and the lower row the expected channel map based on the fitted parameters. The angular scale is indicated on the top left of the figure, and the plot is centered on the adopted position of NGC 4697 (marked with a green “x”). (b) NGC 4697 CO(2–1) channel maps centered at the systematic velocity of this galaxy. For each of the three subplots, the upper row shows the actual data and the lower row the expected channel map based on the fitted parameters. The angular scale is indicated on the top left of the figure, and the plot is centered on the adopted position of NGC 4697 (marked with a green “x”).
Other Images in This Article
Show More
Copyright and Terms & Conditions
© 2026. The Author(s). Published by the American Astronomical Society.

