

Image Details
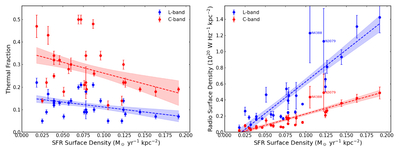
Caption: Figure 6.
Plots of midplane cuts of the thermal fraction (left) and radio surface density (right) vs. SFR surface density. Data are from Table 7, except for the radio surface densities. Trend lines (dashed) are simple linear fits, and colored regions represent the 1σ confidence band on the regression, rather than the scatter in plot. Thermal fraction fits are (L band) fth,L = −0.44 ± 0.21) SFRSD + (0.156 ± 0.019) and (C band) fth,C = − (0.97 ± 0.46) SFRSD + (0.36 ± 0.04). Radio surface density fits are (L band) LSD(1020 W Hz−1 kpc−2) = (7.87 ± 0.85) SFRSD − (0.16 ± 0.08) and (C band) CSD(1020 W Hz−1 kpc−2) = (2.83 ± 0.32) SFRSD − (0.056 ± 0.029). Two AGN galaxies are labeled.
Other Images in This Article
Copyright and Terms & Conditions
© 2026. The Author(s). Published by the American Astronomical Society.

