

Image Details
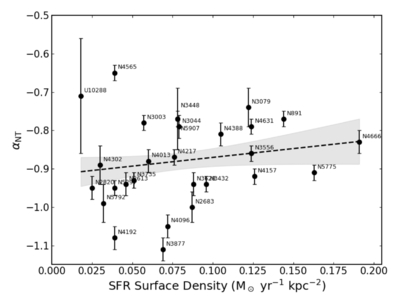
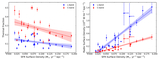
Caption: Figure 4.
Plots of midplane cuts of the nonthermal spectral index, αNT vs. SFR surface density, SFRSD. Data are from Table 7. The trend line (dashed) is a simple linear fit, and the shaded region represents the 1σ confidence band on the regression, rather than the scatter in plot. The fit is αNT = (0.46 ± 0.50) SFRSD – (0.916 ± 0.046).
Other Images in This Article
Copyright and Terms & Conditions
© 2026. The Author(s). Published by the American Astronomical Society.

Copyright ©
2026 Astronomy Image Explorer. All Rights Reserved.
