

Image Details
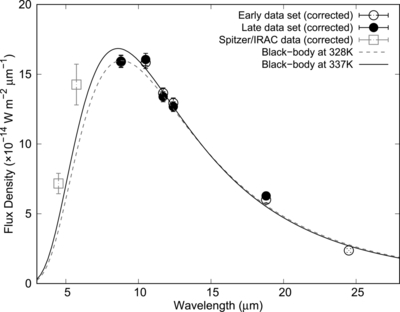
Caption: Figure 7.
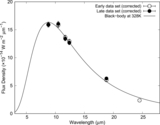
Spectral energy distribution of 2P/Encke based on the photometric data of both the COMICS observations and the IRAC observations, corrected to the epoch of the N-band spectroscopic observation by COMICS (UT 2003 November 12.29). The solid line is the best-fit blackbody spectrum (at 337 K) for all observations. The dashed line is the best-fit blackbody spectrum (at 328 K) for the COMICS observations only.
Other Images in This Article
Copyright and Terms & Conditions
© 2026. The Author(s). Published by the American Astronomical Society.

Copyright ©
2026 Astronomy Image Explorer. All Rights Reserved.
